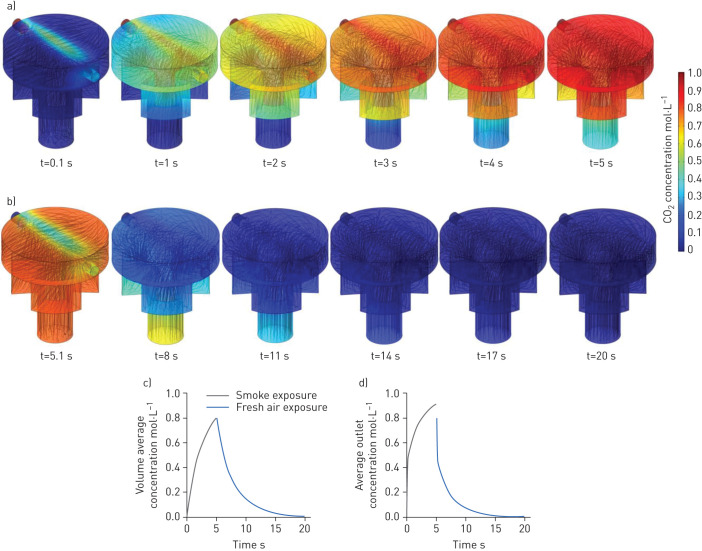
FIGURE 4.
Three-dimensional quantitative modelling results of the gas (CO2) concentration distribution in an in vitro exposure system chamber: a) real-time CO2 concentration distribution over 5 s exposure of smoke (initial CO2 concentration modelled at 1.0 mol·L−1) showing a gentle gas distribution in the exposure chamber; b) real-time CO2 concentration distribution over 5 s exposure of fresh air (the initial CO2 concentration was the final CO2 concentration in the exposure chamber from the previous smoke exposure and it was assumed that there was no CO2 in the fresh air exposed to the chamber); c) volume average concentration of CO2 in the chamber for one smoke–fresh air cycle would lead to a drop in CO2 concentration in the chamber back to zero; and d) average outlet concentration of CO2 after one smoke–fresh air cycle confirming that exposure kinetics were sufficient to reach a repeatable smoke–air exposure cycle (zero concentration at the outlet).

