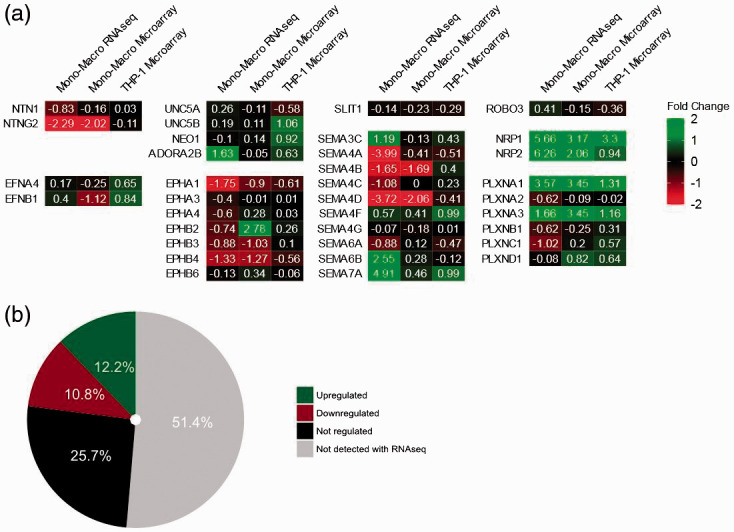
Figure 2.

Change of NGC expression during monocyte-to-macrophage differentiation. (a) Heat map of fold change of NGC expression in log2 scale (green: up-regulation; red: down-regulation; mono–macro RNA-seq n = 1; mono–macro microarray n = 12; THP-1 microarray n = 3). (b) Summary of NGC expression regulation during monocyte/macrophage differentiation.
