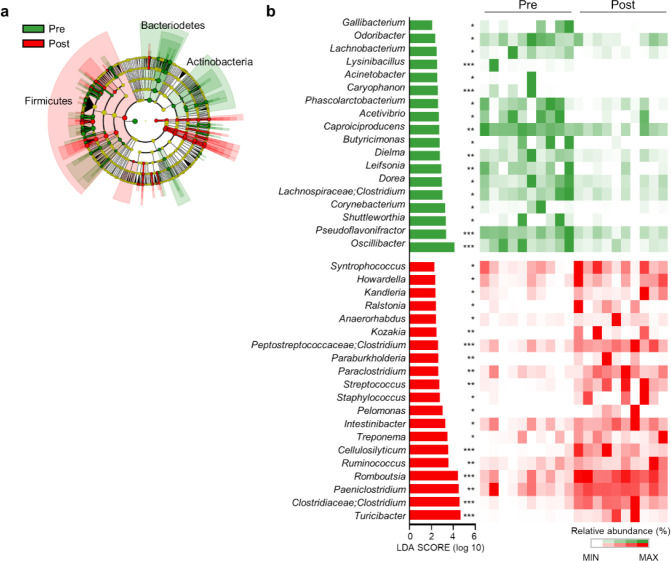
Fig. 3. Microbiota composition in the feces of diarrheic and recovered calves.
(a) Phylogenetic cladogram generated by performing LEfSe analysis, depicting taxonomic associations between the microbiome communities of the pre- and post-treatment groups. Each node represents a specific taxonomic type. (b) The rankings of significantly different genera (based on the LEfSe method) were reflected in the log LDA scores of both groups. LEfSe analysis was based on the nonparametric factorial Kruskal–Wallis rank-sum test, followed by the Wilcoxon signed-rank test. Featured LDA scores > 2.0 are plotted (*p < 0.05, **p < 0.01, ***p < 0.001). LEfSe, linear discriminant analysis effect size; LDA, linear discriminant analysis.

