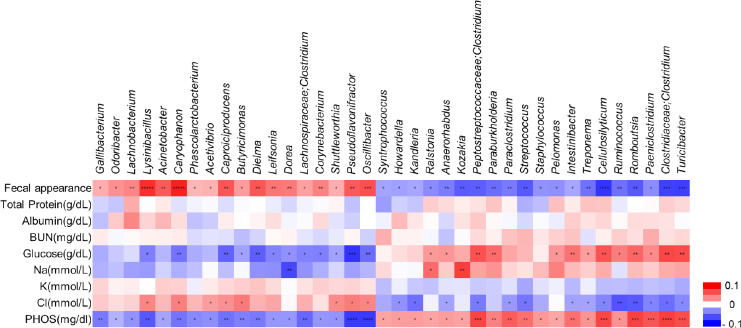
Fig. 5. Correlations between the gut microbiome and physiological parameters.
Spearman’s correlation analysis was used to investigate the relationships between fecal bacterial populations and blood parameters, considering longitudinal results obtained with all groups. The red and blue cells indicate positive and negative correlations, respectively. Correction for multiple comparisons used the false discovery rate (FDR; threshold of 0.05). *p < 0.05, **p < 0.01, ***p < 0.001, ****p < 0.0001. BUN, blood urea nitrogen; PHOS, phosphorus.

