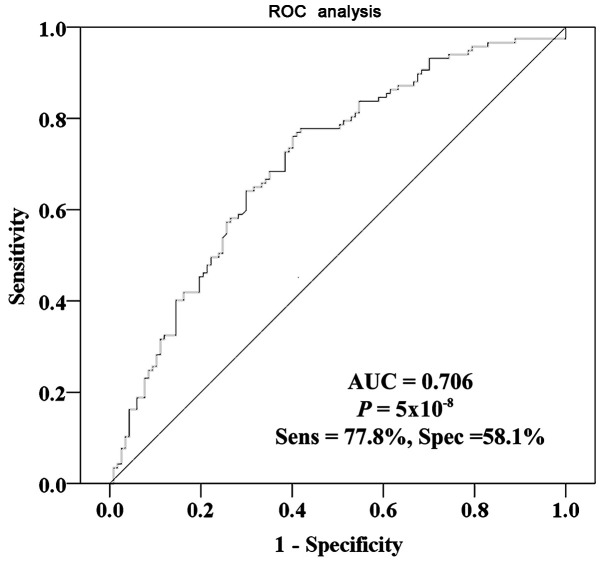
Figure 3.
Diagnostic value of IL10 CGI hypomethylation between gastric cancer tissues and paired para-tumor tissues. ROC curve analysis confirmed the potential diagnostic value of IL10 CGI hypomethylation, and yielded a significant AUC of 0.706 with a sensitivity of 77.8% and a specificity of 58.1% between cancer tissues and para-tumor tissues. AUC, area under the curve; CGI, CpG island; IL10, interleukin 10; ROC, receiver operating characteristic; Sens, sensitivity; Spe, specificity.

