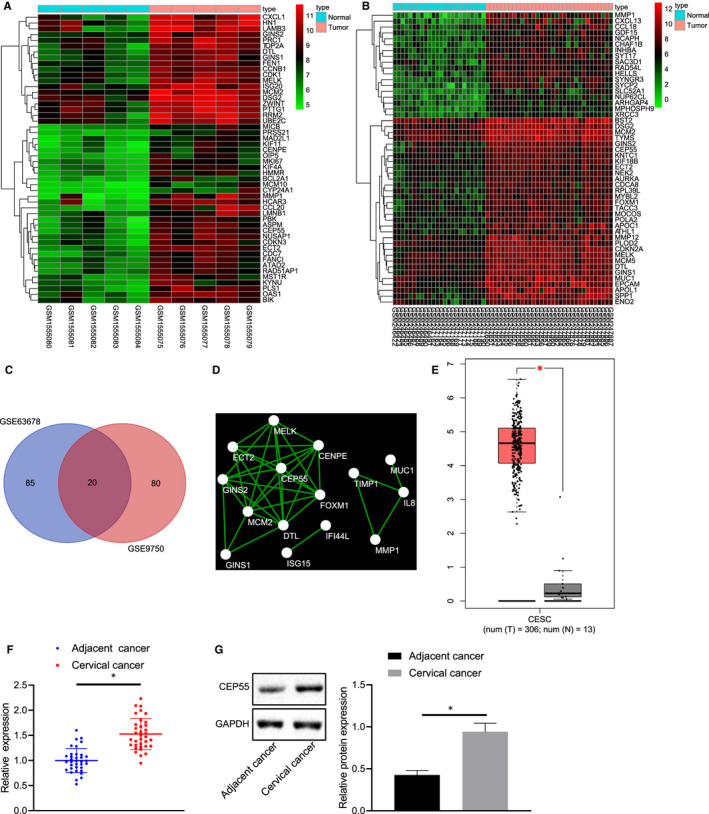
FIGURE 1.

The significance of CEP55 in cervical cancer. A, B, Heat maps of significantly up‐regulated genes in cervical cancer‐related microarray data sets. The abscissa refers to the sample number, the ordinate refers to the genes, the left dendrogram represents the expression level, each cube represents the expression level of a gene in one sample, and the upper right histogram represents the colour scale. C, Venn analysis of significantly up‐regulated genes in cervical cancer‐related microarray data sets. Two circles show the significantly up‐regulated genes in cervical cancer samples in two cervical cancer‐related microarray data sets, and the middle part indicates the intersection of two sets of data. D, The interaction network of significantly up‐regulated genes in cervical cancer samples. Each circle represents a gene and the line between circles indicates the presence of interaction between two genes. E, The expression of CEP55 in cervical cancer samples (the left box plot) and normal samples (the right box plot) according to TCGA database. The abscissa refers to the sample type, and the ordinate refers to the expression level. F, Expression of CEP55 was determined by RT‐qPCR in cervical cancer and adjacent normal tissues, relative to GAPDH. The left image represents the detection results of CEP55 expression in cancer tissues, and the right represents the detection results of CEP55 expression in adjacent normal tissues. G, Representative Western blots of CEP55 protein and its quantitation (on the right side) in cervical cancer and adjacent normal tissues, relative to GAPDH. Data between cervical cancer tissues and adjacent normal tissues were compared with paired t test
