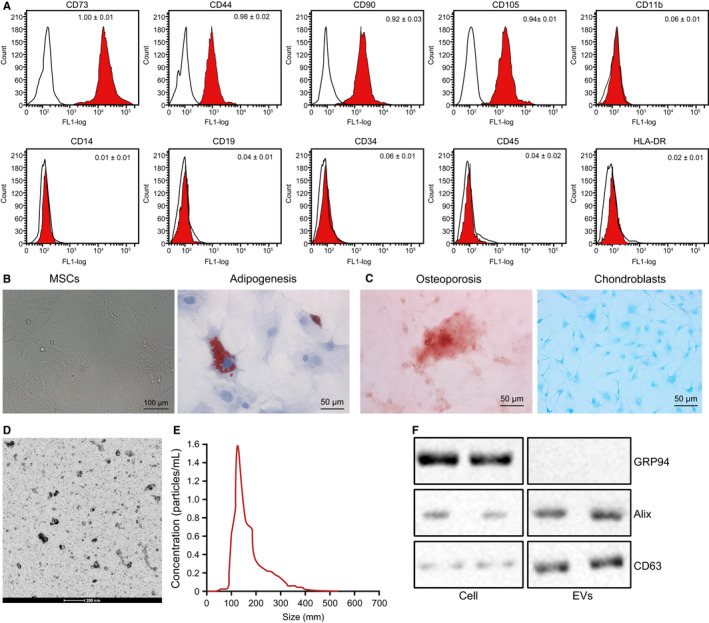
FIGURE 5.

hBMSCs are successfully isolated. A, Expression of surface antigens of hBMSCs was identified by flow cytometry. B, Morphology of hBMSCs under an optical microscope (scale bar = 100 µm). C, Adipogenic (left), osteogenic (middle) and chondrogenic (right) differentiation of hBMSCs were detected by oil red O staining, Alizarin red staining and Alcian blue staining (scale bar = 50 µm). D, Morphology of EVs under a TEM (scale bar = 200 nm). E, Size distribution of EVs was detected by NTA. F, Representative Western blots of EV marker proteins and their quantitation in hBMSCs
