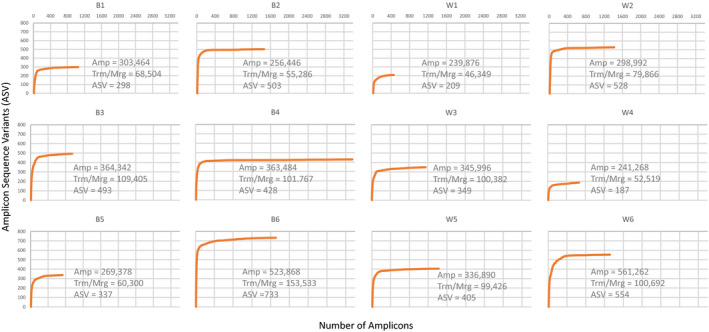
FIGURE 3.

Log transformed rarefaction plots for each of the Lindgren funnel trap saturated salt solution samples. Amplicons with more than 10 reads were included. Numbers in the figure represent the total number of amplicons (Amp), the number of sequences after end trimming and paired‐end read merging (Trm/Mrg), and the final number of amplicon sequence variants (ASV)
