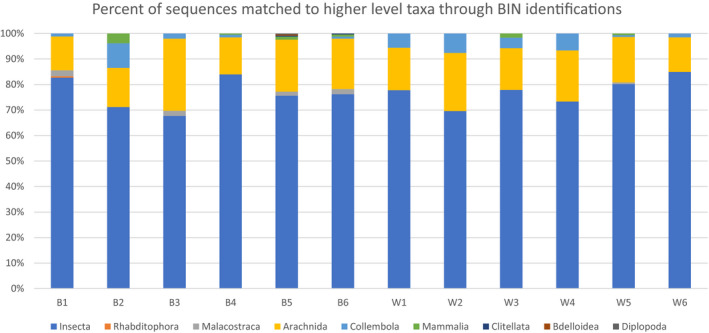
FIGURE 4.

Higher‐level taxonomic identification of sequences using mBRAVE for all collected traps, six sites in Windsor Ontario (B1–B6) and six sites in Wheatley Ontario (W1–W6). Bar chart segments represent the percentage of unique sequences with greater than 10 reads identified to phyla (excluding fungal and bacterial sequences)
