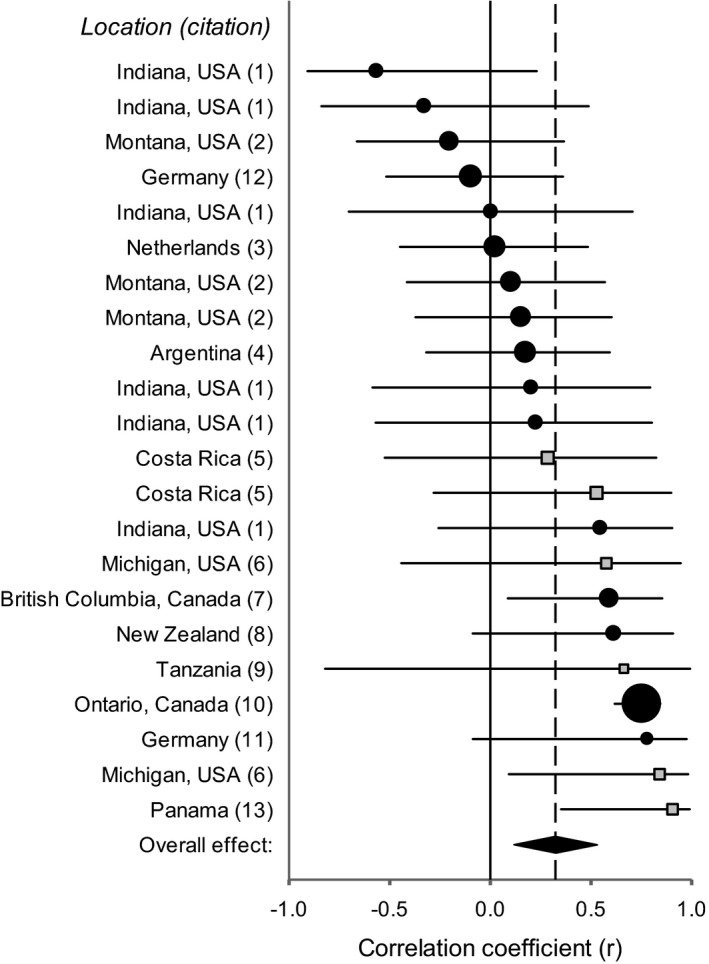
FIGURE 2.

Effect sizes for the correlation between plant abundance in the field and plant‐soil feedback (PSF) for herbaceous (black circles) and woody (gray squares) plant species for many experiments. Graph depicts the results for one of eight analyses (see = 0.32 in Table 1). Study information (location and citation) is provided to the left of the figure, the center of each symbol indicates the effect size (correlation coefficient r, x‐axis) and the whiskers indicate lower and upper 95% confidence intervals. Circle and square symbol sizes reflect the weighting (i.e., number of species per correlation coefficient) for each experiment in the analysis. The overall effect (pooled weighted correlation coefficient, ) is indicated by the diamond symbol at the bottom of the plot, where = 0.32 (0.10; 0.51) and p = .0050. 1 = (Bauer et al., 2015), 2 = (Reinhart, 2012), 3 = (Giesen, 2006), 4 = (Chiuffo et al., 2015), 5 = (McCarthy‐Neumann & Kobe, 2010), 6 = (McCarthy‐Neumann & Ibáñez, 2012), 7 = (MacDougall et al., 2011), 8 = (Diez et al., 2010), 9 = (Rutten et al., 2016), 10 = (Klironomos, 2002), 11 = (Johannes Heinze, Joana Bergmann, and Jasmin Joshi, unpublished), 12 = Heinze et al., 2020), 13 = (Mangan et al., 2010)
