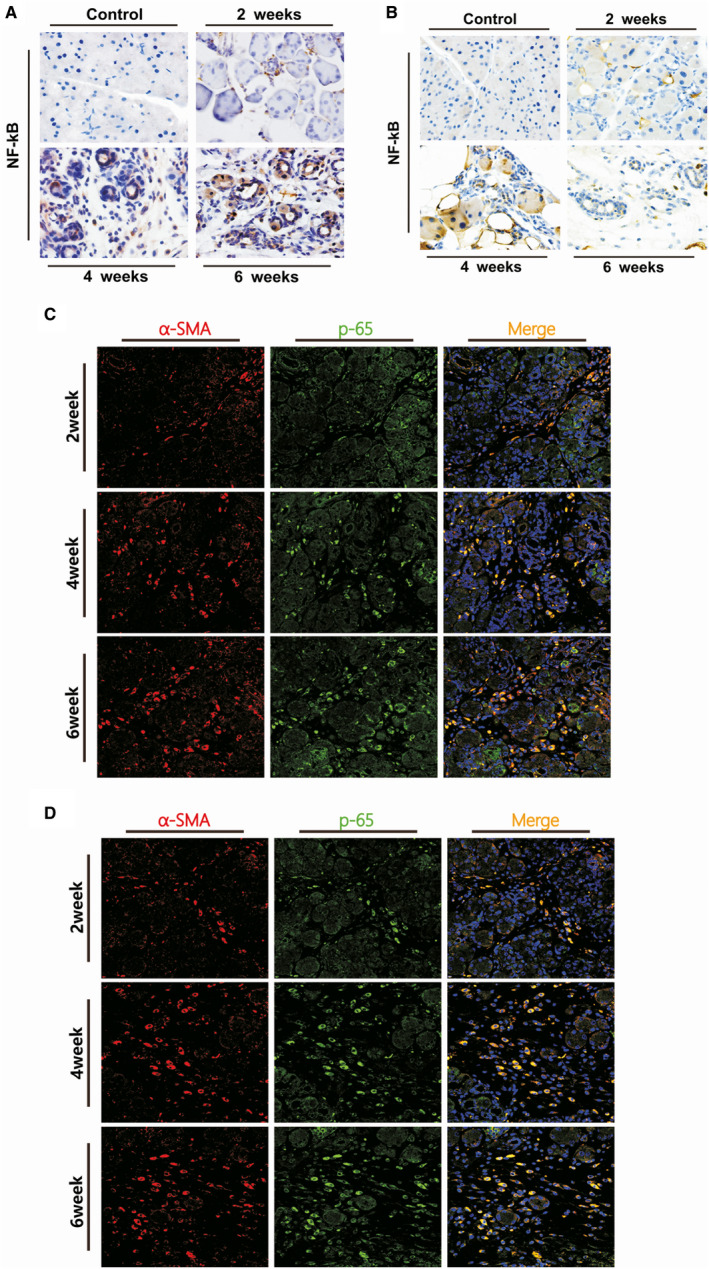
Figure 2.

Localization of NF‐κB p65 in the PSCs after the induction of CP at weeks 2, 4 and 6 in both murine models. A, B, IHC staining for NF‐κBp65, the brown colour denoting positive cells (original magnification: 200×). C, D, Immunofluorescence double staining of α‐SMA and p65 in the murine models of CP. DyLight 594–conjugated α‐SMA (red), DyLight 488–conjugated p65 (green), DAPI (blue) and co‐expression areas (orange). Original magnification: 400×
