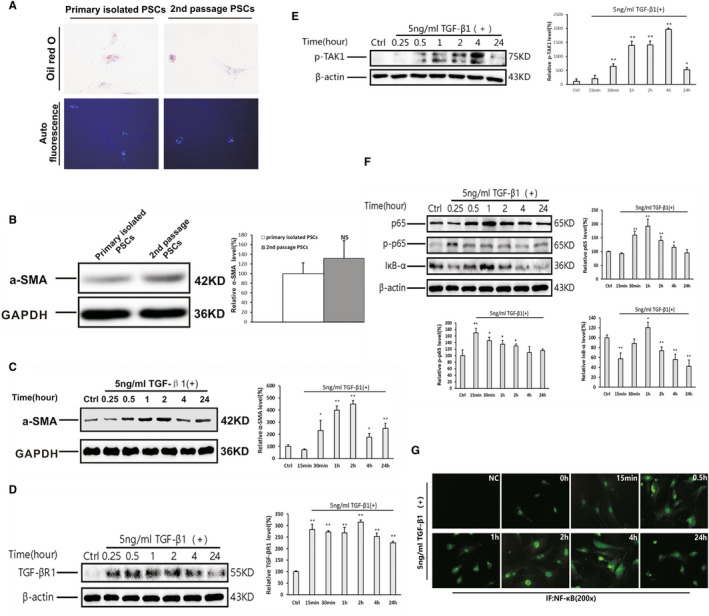
Figure 3.

Overactivation of the NF‐κB signalling pathway in the PSCs following stimulation with TGF‐β1. A, Oil Red O staining and autofluorescence in primary isolated and the second passage of PSCs. B, Western blotting analysis of the expression of α‐SMA in primary isolated and the second passage of PSCs at 5 days of culture, with GAPDH used as a loading control. C–F, Western blotting analysis of the expression of α‐SMA (C), TGF‐βR1 (D), p‐TAK1 (E), p65, p‐p65 and IκB‐α (F) in PSCs stimulated with 5 ng/mL of TGF‐β1, with GAPDH or β‐actin used as a loading control (representative blot, n = 3). The relative protein abundance was quantified through densitometry analysis and normalized against GAPDH or β‐actin. The TGF‐β1 treatment group vs the control group: * P < .05, ** P < .01. G, Immunofluorescent staining of NF‐κB p65 in the PSCs stimulated with 5 ng/mL of TGF‐β1 at different measurement time‐points. NC means negative control without primary antibody of NF‐κB p65 (original magnification: 200×)
