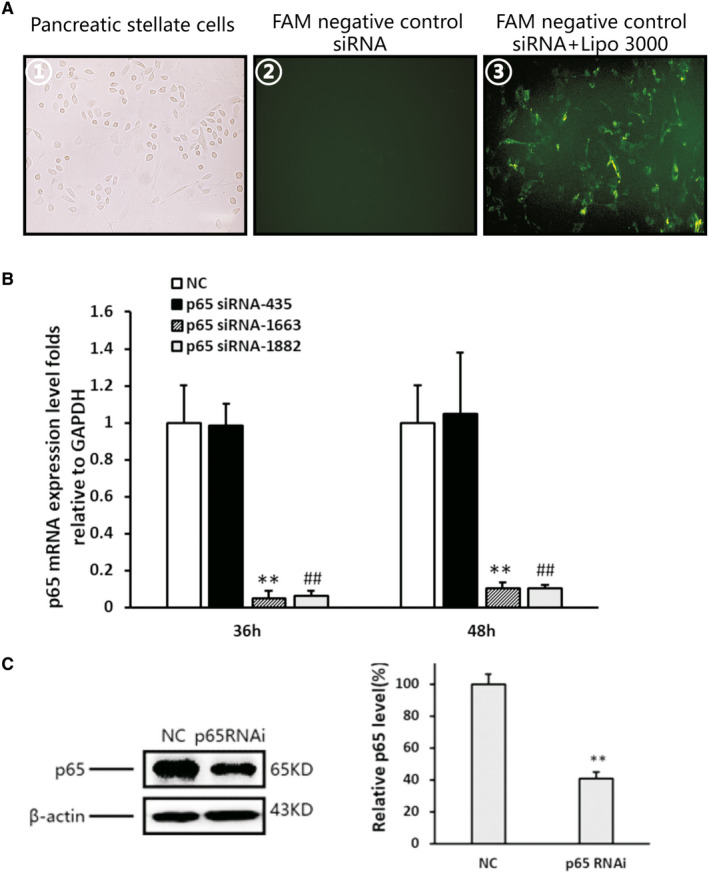
Figure 4.

Lipotransfection of NF‐κBp65 siRNA and transfection efficiency. A, ① No transfected PSCs under light microscopy; ② PSCs cultured with FAM‐negative control siRNA without Lipofectamine 3000; and ③ PSCs transfected with FAM‐negative control siRNA using Lipofectamine 3000 (original magnification: 200×). B, Three siRNA sequences of NF‐κBp65 transfection induced alterations in the expression of p65 mRNA in the PSCs. Data shown are percentages compared with that of the negative control siRNA‐transfected cells. p65‐1663 vs the control: ** P < .01, p65‐1882 vs the control: ## P < .01. C, Western blotting and densitometry analysis showing a reduction in the expression of p65 protein after transfection of p65 siRNA. β‐actin was used as a loading control. p65 siRNA vs the negative control: ** P < .01
