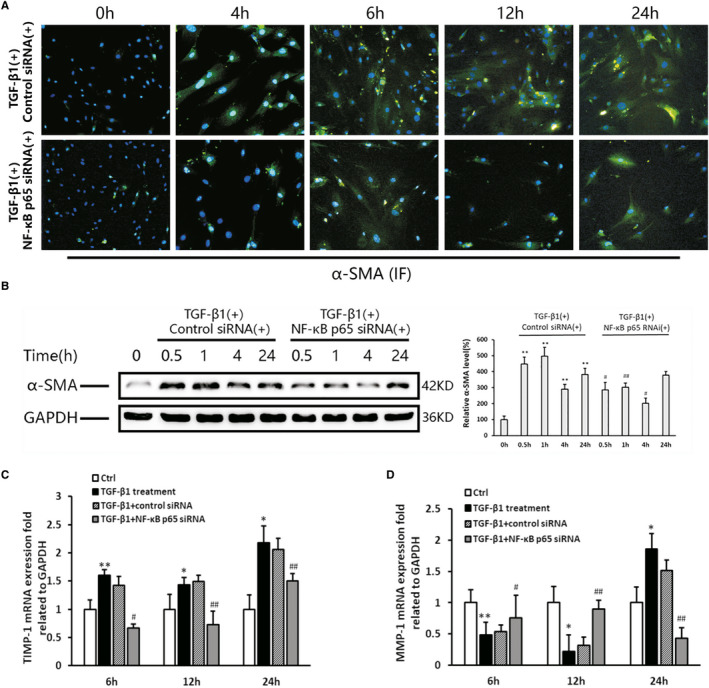
Figure 5.

PSC activation and fibrosis‐related factor expression in response to p65 RNAi. A, Immunofluorescent staining of α‐SMA (original magnification: 200×). B, Western blotting and densitometry showing the expression of α‐SMA. GAPDH is shown as a loading control (representative blot, n = 3). The relative protein abundance was quantified through densitometry analysis normalized against GAPDH. The TGF‐β1 group vs the control group: * P < .05, ** P < .01; the p65RNAi group vs the control RNAi group: # P < .05, ## P < .01. C, D, The MMP‐1 and TIMP‐1 mRNA expression levels in the PSCs were tested using the real‐time PCR (n = 3). The TGF‐β1 group vs the control group: * P < .05, ** P < .01; the p65RNAi group or control RNAi group vs the TGF‐β1 treatment group: # P < .05, ## P < .01
