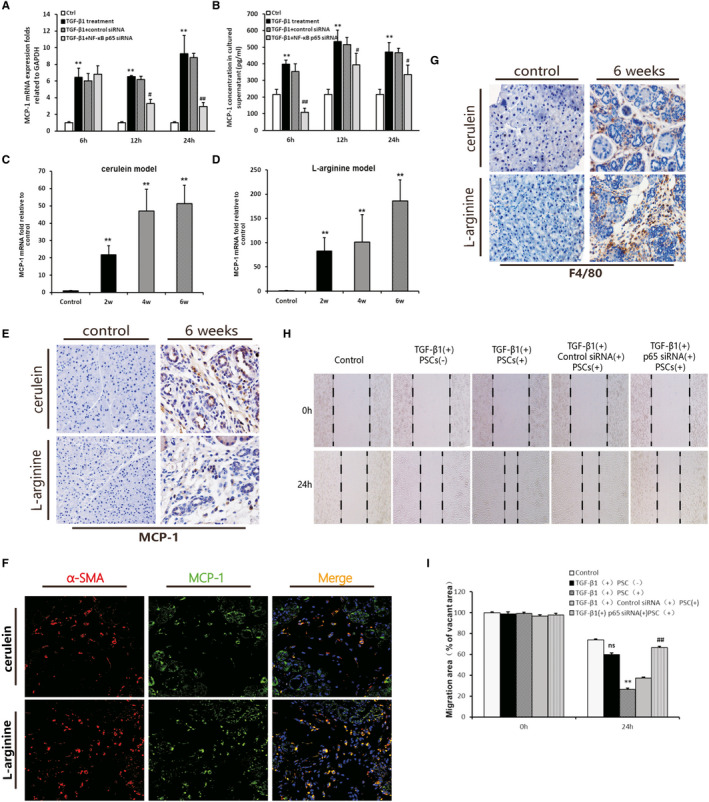
Figure 6.

The effects of NF‐κBp65 knockdown in PSC on the production of MCP‐1 and migration of macrophages. A, MCP‐1 mRNA expression levels in the PSCs (n = 3). B, MCP‐1 concentrations in the PSC culture supernatant (n = 3). The TGF‐β1 group vs the control group: *P < .05, **P < .01; the p65RNAi group or control RNAi group vs the TGF‐β1 treatment group: # P < .05, ## P < .01. C, D, MCP‐1 mRNA expression levels in the two CP models at weeks 2, 4 and 6 (n = 4). Different time‐points vs the control group: ** P < .01. E, IHC staining for MCP‐1 in the two CP models after 6 weeks (original magnification: 200×). F, Immunofluorescence double staining of α‐SMA and MCP‐1 in the murine models of CP. DyLight 594–conjugated α‐SMA (red), DyLight 488–conjugated p65 (green), DAPI (blue) and co‐expression areas (orange). Original magnification: 400×. G, IHC staining for F4/80 (original magnification: 200×). H, Representative images of the scratch wound assay on the migration of BMDMs cultured with different conditional medium of PSC. The black dotted lines indicate the wound borders at the beginning of the assay and those recorded 0 h and 24 h post‐scratching (original magnification: 100×). I, Quantitative analysis of the migration of BMDMs. The relative scratch gap was calculated as the ratio of the remaining scratch gap at 24 h post‐scratching and over that at 0 h (n = 3). The TGF‐β1 with PSC group or TGF‐β1 without PSC group vs the control group: ns (no significance), ** P < .01; the p65RNAi group or control RNAi group vs the TGF‐β1 with PSC group: ## P < .01
