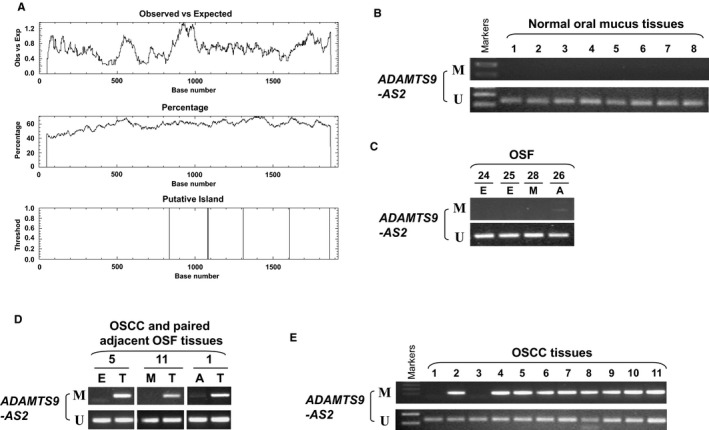
FIGURE 2.

ADAMTS9‐AS2 methylation during OSF progression. (A) Promoter CpG island analysis of the ADAMTS9‐AS2 promoter and exon 1 regions by the EMBOSS Cpgplot (http://www.ebi.ac.uk/Tools/seqstats/emboss_cpgplot/). Representative ADAMTS9‐AS2 methylation by MSP in (B) normal oral mucosa tissues, (C) OSF tissues, (D) OSCC and paired adjacent OSF tissues, and (E) OSCC tissues. M, methylated; U, unmethylated; E, early stage of OSF; M, moderately advanced stage of OSF; A, advanced stage of OSF; N, normal tissue; T, OSCC
