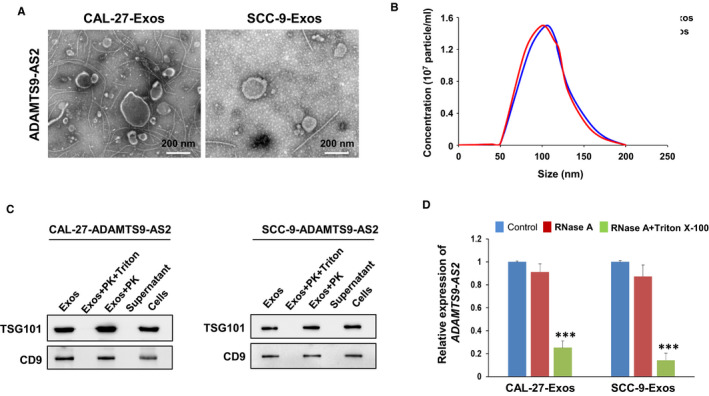
FIGURE 3.

Identification and analysis of exosomal ADAMTS9‐AS2 derived from OSCC cells. A, Exosomes isolated from supernatants of ADAMTS9‐AS2–expressing OSCC cells were analysed by transmission electron microscopy. Scale bar = 200 nm. B, Size distributions and numbers of exosomes isolated from the culture media of ADAMTS9‐AS2–expressing OSCC cells by NanoSight particle tracking. C, Western blot analysis of the representative proteins as positive markers of exosomes (TSG101, CD9) in exosome extracts, with or without treatment of Triton X‐100 + proteinase K (PK) or proteinase K (PK) alone. D, qRT‐PCR analysis of ADAMTS9‐AS2 in the CM of OSCC cells with treatment of RNase (2 mg/mL) alone or combined with Triton X‐100 (0.1%) for 20 min (n = 3). Exos, exosomes
