FIGURE 5.

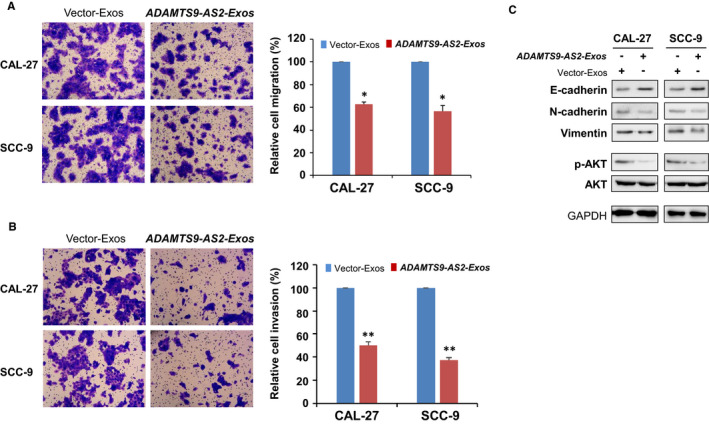
Exosomal ADAMTS9‐AS2 suppressed OSCC cell migration and invasion. Cell migration (A) and invasion (B) abilities of OSCC cells upon treatment with ADAMTS9‐AS2–expressing exosomes were measured by Transwell assays. Representative images were photographed following fixation and staining. Scale bars: 50 μm. Data are presented as the mean ± SD. *P < .05; **P < .01. C, Western blot analysis of EMT markers and AKT signalling pathway in OSCC cells with treatment of ADAMTS9‐AS2–expressing exosomes and control exosomes. Exos, exosomes
