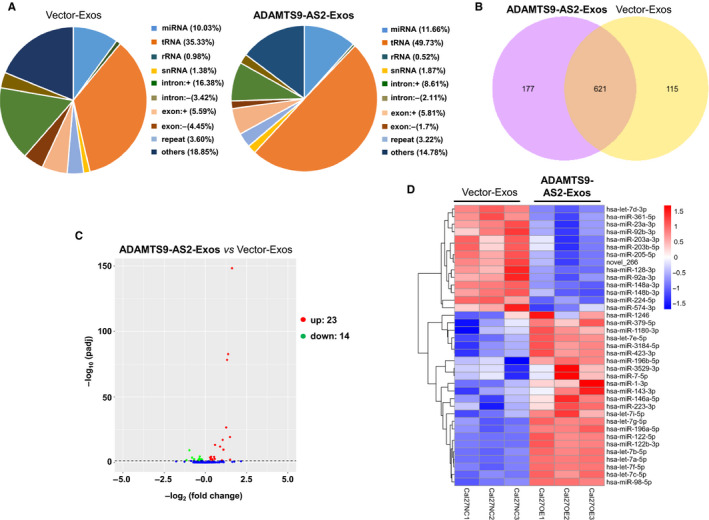
FIGURE 6.

miRNA expression profiles of exosomal ADAMTS9‐AS2. A, The percentage of small RNA categories in all reads mapped to non‐coding RNA databases. B, Venn diagram showing the unique and overlapping miRNAs between ADAMTS9‐AS2–expressing exosome‐treated groups and control groups. C, Volcano plot showing differential miRNAs in OSCC cells treated with ADAMTS9‐AS2–expressing exosomes and control exosomes. P < .01 and fold change >2 were considered significant. D, Heat map diagram of differential miRNA expression by exosomal ADAMTS9‐AS2. Expression values shown are mean‐centred. Red, increased expression; blue, decreased expression; and white, mean value. Exos, exosomes
