
Figure 4.
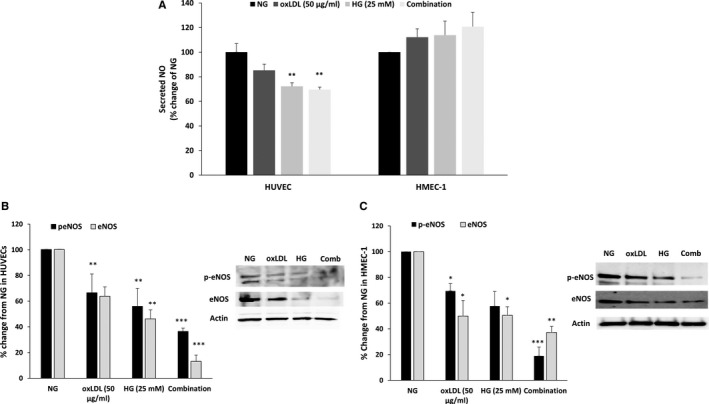
Combination of HG and OxLDL significantly down‐regulates eNOS activity. HUVECs and HMEC‐1 were cultured and treated as in Figure 3. NO metabolites secretion in the supernatants was measured using colorimetric assay (A). HUVECs (B) and HMEC‐1 (C) cells were collected and examined for eNOS and p‐eNOS expression using Western blot. Results are represented as mean ± SEM, n = 2‐9 in each treatment group. *P < .05, **P < .01, ***P < .001