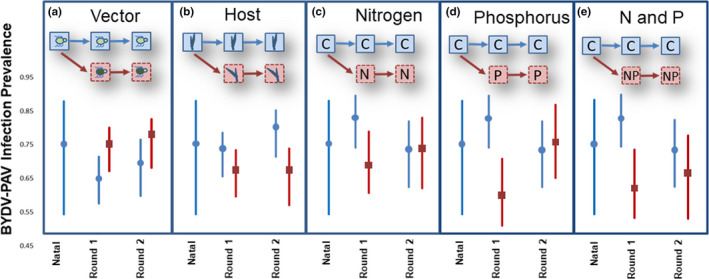
FIGURE 1.

Altered nutrient conditions cause a reduction in BYDV‐PAV infection prevalence. In each panel, infection prevalence for Round 1 and Round 2 for the respective treatment, averaged across all other treatments. For (a) vectors S. avenae (blue line) and R. padi (red line), (b) hosts A. sativa (blue line) or H. vulgare (red line), (c) control (blue line) or nitrogen addition (red line), (d) control (blue line) or phosphorus addition (red line), (e) control (blue line) or nitrogen and phosphorus (N and P) (red line) nutrient treatments. The blue line at the left of each panel represents the natal infection prevalence which was calculated using the average prevalence over all treatments. Error bars represent 95% confidence intervals
