
FIGURE 3.
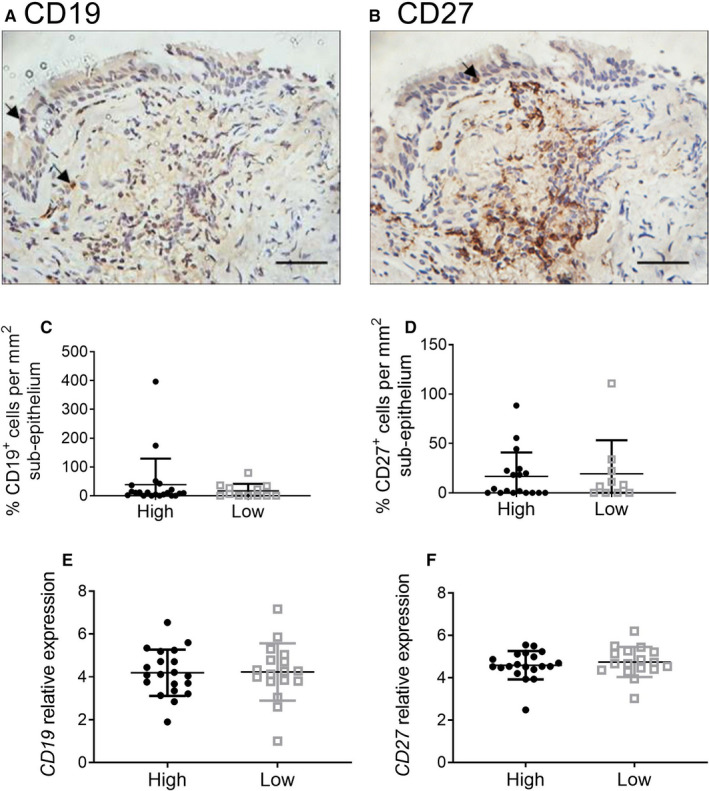
Quantification of CD19+ B cells and CD27+ plasma cells in bronchial tissue from eosinophilhigh and eosinophillow patients. Bronchial biopsies were formalin‐fixed, paraffin‐embedded. Tissue sections were stained for CD19 (A &C) and CD27 (B & D) with results presented as the number of positive cells per mm2 of subepithelium. Images A and B represent typical staining; size bars illustrate 100 μm. RNA was extracted and sequenced from bronchial brush samples. Data are presented as relative gene expression for CD19 (E) and CD27 (F). Comparisons between eosinophilhigh and eosinophillow were by Mann‐Whitney test: all non‐significant. Bars represent median values with interquartile range