
FIGURE 4.
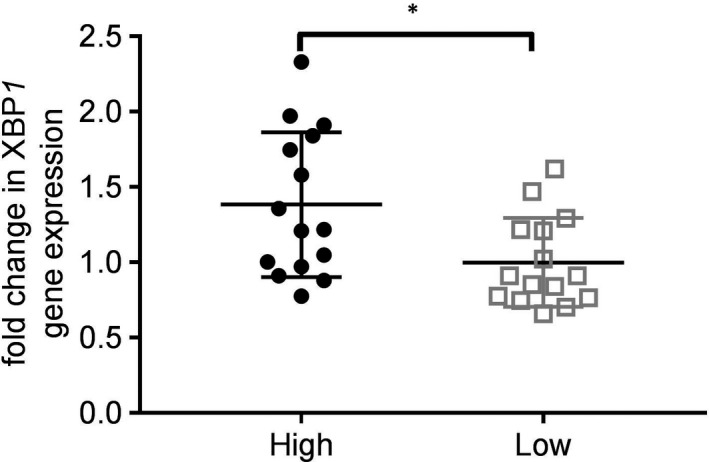
Activation of B‐cell XBP1 gene expression following treatment with BAL from eosinophilhigh and eosinophillow patients. B cells were isolated from the blood of a healthy subject, and then treated with BAL fluid for 72 h. Gene expression of XBP1 was assessed by quantitative PCR, with data presented as fold change compared to untreated B cells. Comparison between eosinophilhigh and eosinophillow was by t test: *P < .05. Bars represent mean values ± standard deviation