
FIGURE 1.
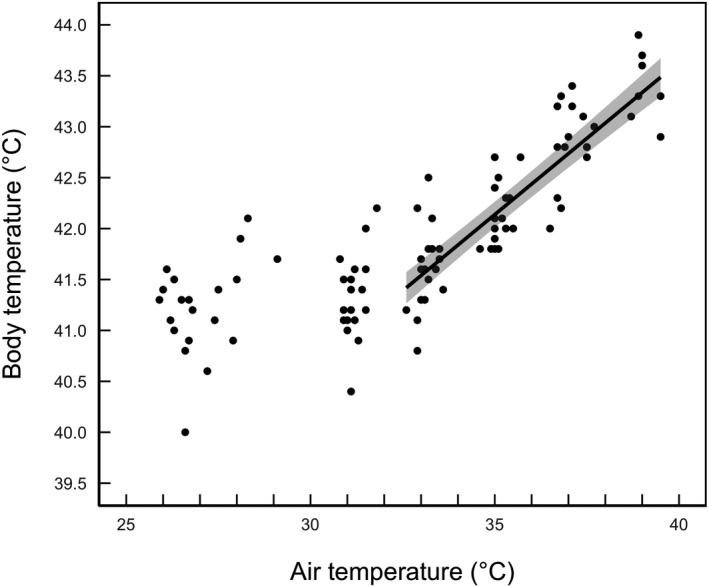
The relationship between core body temperature (T b) measured in the cloaca and air temperature (T a). The regression line represents the slope from a linear mixed‐effects model of T b regressed against T a above the inflection point (32.6°C). The shaded area represents the 95% confidence intervals around the predicted values