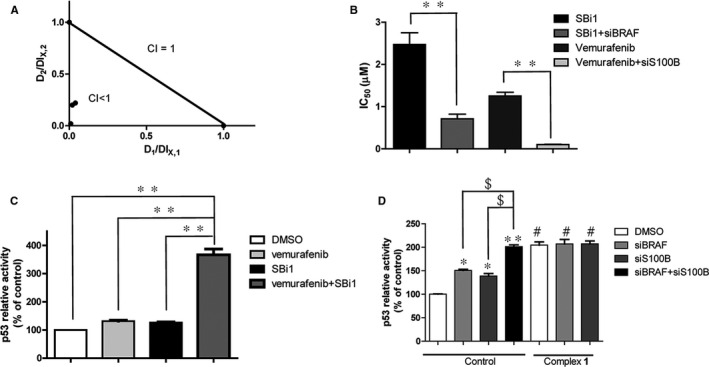
Figure 3.

Cooperativity of S100B/p53 and MEK/ERK inhibition by complex 1. (A) The combination index (CI) of co‐treatment of vemurafenib with SBi1. After co‐treatment of vemurafenib (2 μM) with SBi1 (0‐10 μM) in A375 cells for 72 h, cell viability was detected by the MTT assay, and then, CI values were calculated. D1 and D2 are the concentrations of vemurafenib and SBi1 used in the combination, and DLX,1 and DLX,2 are the concentrations of a single drug to produce the same effect. (B) The IC50 values of SBi1 and vemurafenib in knockdown A375 cells. S100B or BRAF knockdown cells were treated with SBi1 and vemurafenib, respectively, for 72 h, and cell viability was detected by the MTT assay. (C) p53 transcription activity in A375 cells. After treatment of vemurafenib (0.25 μM) together with SBi1 (0.25 μM) or alone (0.5 μM) for 12 h, p53 transcription activity was detected by the luciferase assay. (D) p53 transcription activity in A375 cells. After treatment with complex 1 for 12 h in BRAF and S100B knockdown cells, p53 transcription activity was detected by the luciferase assay. Error bars represent standard deviation of the means of the results from three independent experiments. *P < .05, **P < .01 compared with control group, $ P < .05 compared with knockdown control, # P < .05 compared with corresponding control
