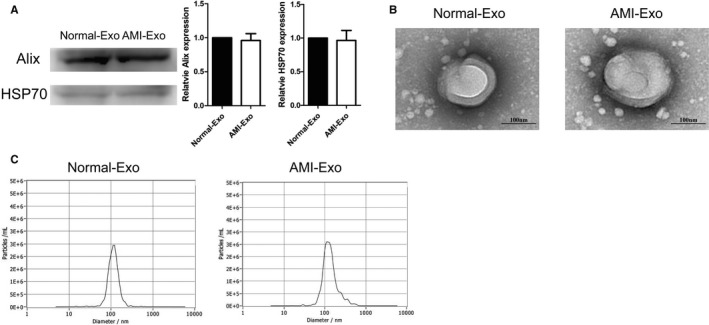
FIGURE 1.

Biological identification of circulating exosomes from patients. (A) HSP70, and Alix expression levels in Normal‐Exo and AMI‐Exo (n = 3). (B) Exosome scanning results of transmission electron microscopy (TEM). Bars indicated 100 nm. (C) The particle diameter distribution ratio tested by Nanoparticle tracking analysis of Normal‐Exo and AMI‐Exo
