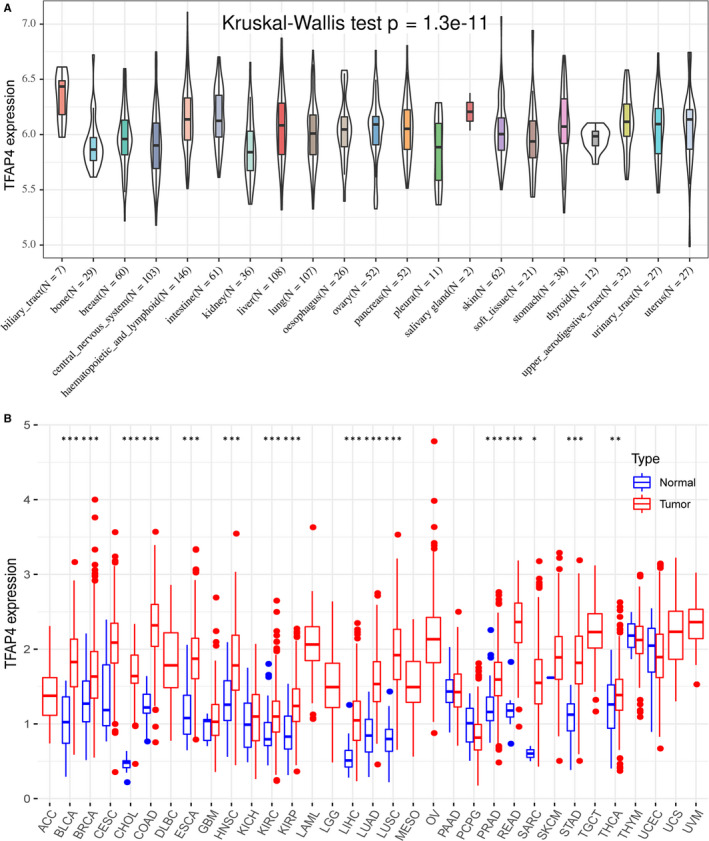
Figure 1.

The TFAP4 expression level in human pan‐cancer analyses. (A) The mRNA level of TFAP4 in CCLE. (B) The mRNA level of TFAP4 in TCGA. The blue and red bar graphs indicate normal and tumour tissues, respectively. *P < .05; **P < .01; ***P < .001
