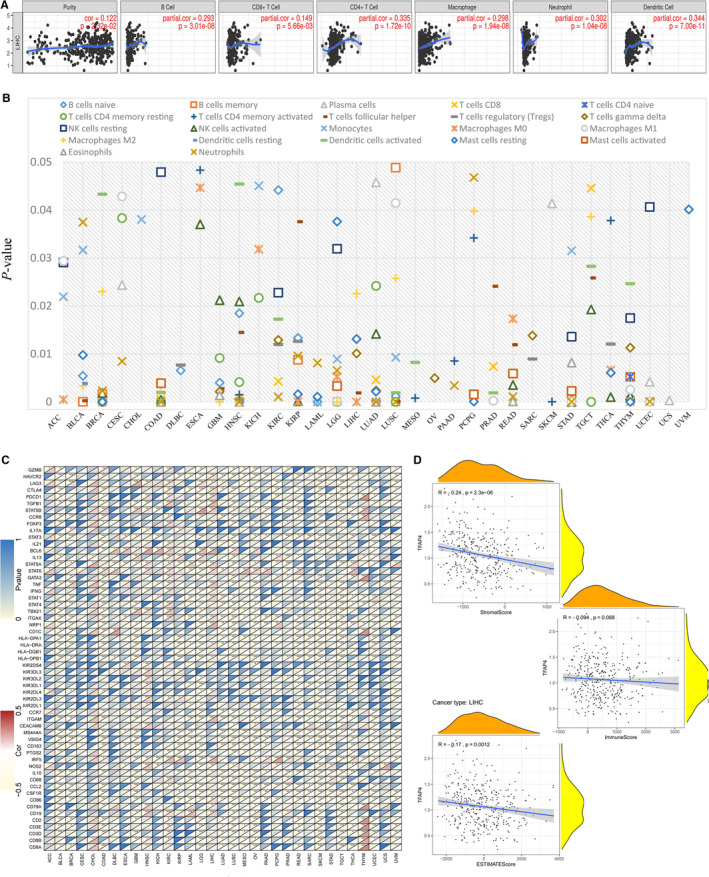
Figure 7.

TFAP4 expression is correlated with cancer immunity. (A) TIMER predicts that the TFAP4 level is related to the degree of immune infiltration within HCC. (B) CIBERSORT predicts that TFAP4 expression is correlated with immunocytes. (C) Heat map represents the colour‐coded correlations of immune markers and TFAP4 across 33 types of cancer. For each pair, the left top triangle is coloured to represent the P‐value; the right bottom one is coloured to indicate the Spearman correlation coefficient. *P < .05; **P < .01; ***P < .001. (D) The association of TFAP4 with the ESTIMATE scores within HCC
