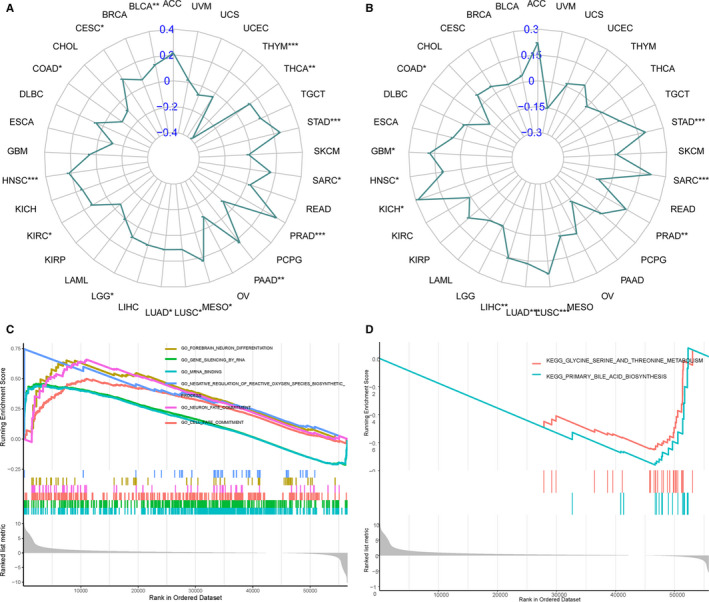
Figure 8.

Correlation of TFAP4 expression with TMB and MSI, and the subsequent GSEA analysis. (A) Radar chart displays the overlap between TFAP4 and TMB. Blue number represents the Spearman correlation coefficient. (B) Radar chart displays the overlap between TFAP4 and MSI. Blue number represents the Spearman correlation coefficient. (C) GSEA shows the top GO terms or KEGG pathways correlated with TFAP4 expression in HCC. *P < .05; **P < .01; ***P < .001
