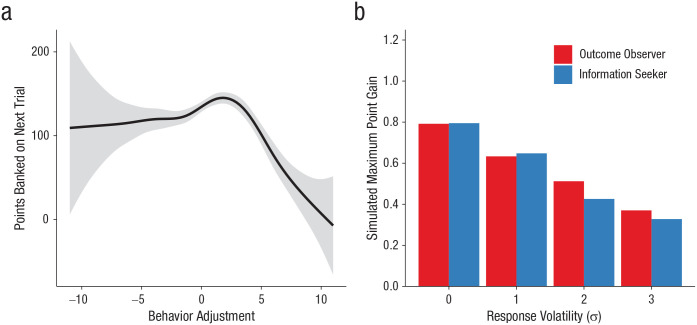
Fig. 4.
Detailed analysis and simulation of the potential instrumentality of information in the current task. The smoothed relationship between behavior adjustment and subsequent points banked on the next trial (a) is shown across all five experiments. The gray area around the line represents the standard error. The results of mathematical simulations comparing adjustments based on the outcome of the trial alone or the missed opportunity are shown in (b). The graph shows the maximum point gain of two types of participant as a function of the magnitude of response volatility. After the outcome is revealed, participants always either seek information about the balloon’s limit (information seekers) or decline to see the balloon’s limit (outcome observers).

