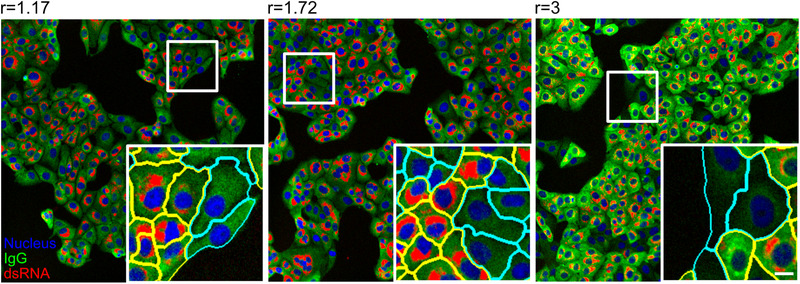
FIGURE 3.

Examples of results from the automated image analysis pipeline. Panels display images that correspond to three different ratio scores (ratio score is indicated above the image) determined from samples stained with three different human sera, followed by staining with an anti‐IgG secondary antibody coupled to AlexaFluore488. Images represent overlays of three channels—nuclei (blue), IgG (green) and dsRNA (red). White boxes mark the zoomed area. Cells in the insets are highlighted with yellow or cyan boundaries, indicating infected and non‐infected cells, respectively. Scale bar = 10 μm
