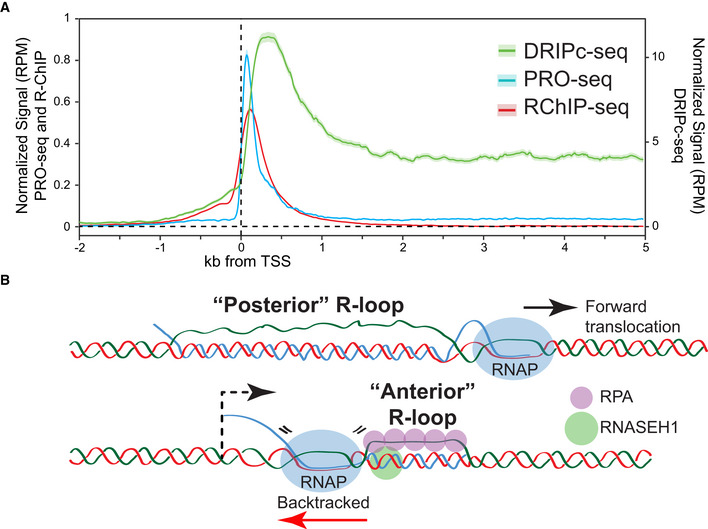
Figure 1. Discrepancies in R‐loop distribution patterns obtained by S9.6‐ and dRNase H1‐based approaches.

(A) Population‐average distributions of dRNase H1 (measured by R‐ChIP‐seq in HEK293 cells (Chen et al, 2017)), nascent transcription (measured by PRO‐seq in HeLa cells), and R‐loops (measured by DRIPc‐seq in HeLa cells) around the TSS of genes positive for R‐ChIP‐seq signals. (B) Schematic of “posterior” R‐loops and “anterior” R‐loops that may form around the TSS of genes upon RNA polymerase backtracking. Speculative binding of RPA and RNASEH1 to posterior R‐loops are shown.
