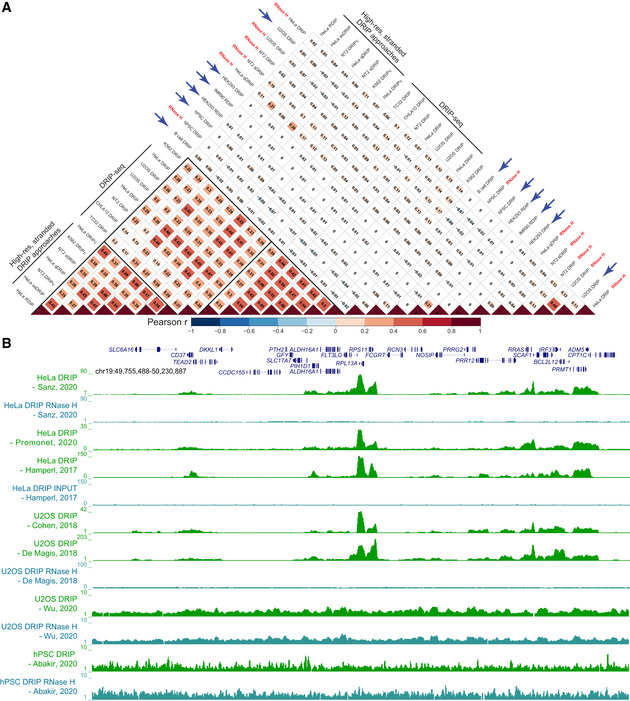
Figure 2. Addressing variability in DRIP‐seq experiments.

(A) Dataset comparison using Pearson’s correlation analysis. Pearson’s correlation values were calculated pairwise on normalized, log‐transformed signals from the indicated datasets and reported as a heatmap. Correlation was calculated over a set of test regions consisting of “gold standard” genes recently characterized using bisulfite‐based single‐molecule R‐loop footprinting, SMRF‐seq (Malig et al, 2020). In the example shown here, each “gold standard” region was extended by 10 kb on each side before correlation analysis. Similar results were obtained if the regions were extended by 100 kb instead, or if other genic regions chosen at random were used. When a dataset included multiple replicates, correlation analysis was performed on each replicate and then averaged. “RNase H” indicates that a sample had been pre‐treated with RNase H to destroy R‐loops prior to DRIP. Blue arrows highlight discordant datasets. (B) Genome browser screenshot over a large region centered around the standard “gold standard” housekeeping gene RPL13A. For simplicity, only a subset of DRIP‐seq datasets are shown, along with two discordant datasets identified here (bottom). Datasets are identified by their respective publication (first author and year). See Dataset EV1 for a detailed list.
