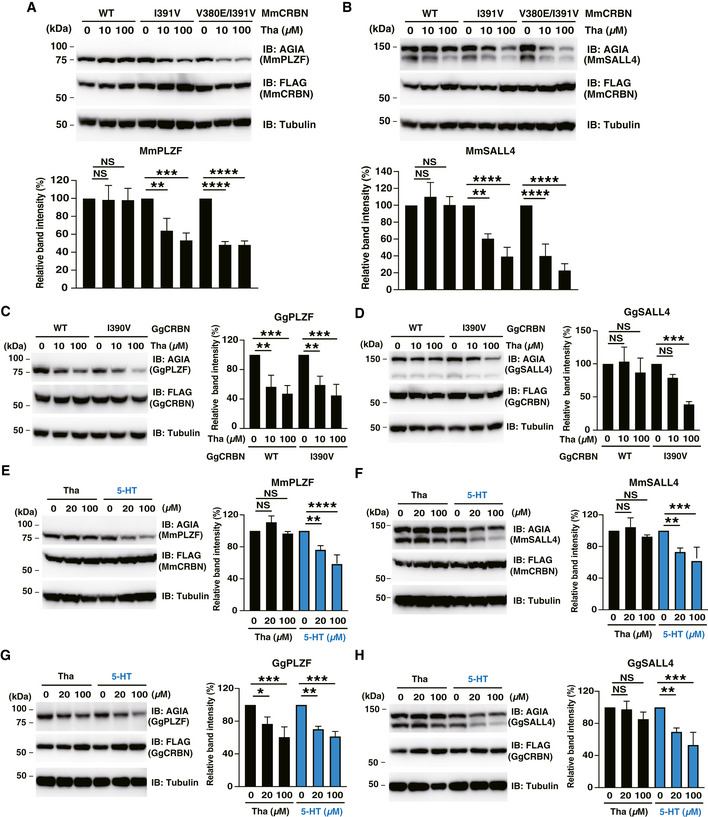
Figure 5. CRBN‐dependent degradation of PLZF and SALL4 from mouse and chicken by treatment with thalidomide and 5‐hydroxythalidomide.

-
A, BImmunoblot analysis of AGIA‐MmPLZF (A) or AGIA‐MmSALL4 (B) in FLAG‐MmCRBN‐WT, FLAG‐MmCRBN‐I391V or FLAG‐MmCRBN‐V380E/I391V expressing CRBN−/− HEK293T cells treated with DMSO or thalidomide (Tha) for 16 h.
-
C, DImmunoblot analysis of AGIA‐GgPLZF (C) or AGIA‐GgSALL4 (D) in FLAG‐GgCRBN‐WT or FLAG‐GgCRBN‐I390V expressing CRBN−/− HEK293T cells treated with DMSO or thalidomide (Tha) for 16 h.
-
E, FImmunoblot analysis of AGIA‐MmPLZF (E) or AGIA‐MmSALL4 (F) in FLAG‐MmCRBN‐WT expressing CRBN−/− HEK293T cells treated with indicated concentration of DMSO, thalidomide (Tha) or 5‐hydroxythalidomide (5‐HT) for 16 h.
-
G, HImmunoblot analysis of AGIA‐GgPLZF (G) or AGIA‐GgSALL4 (H) in FLAG‐GgCRBN‐WT expressing CRBN−/− HEK293T cells treated with indicated concentration of DMSO, thalidomide (Tha) or 5‐hydroxythalidomide (5‐HT) for 16 h.
Data information: Data in bar graphs in (A–H) were calculated as relative (Gg or Mm) PLZF or SALL4 band intensity with (Gg or Mm) PLZF or SALL4, respectively. The band intensity of DMSO was 100. Error bars denote ± standard deviation (n = 3). P‐values were calculated by one‐way ANOVA with Tukey's post hoc test (NS = not significant, *P < 0.05, **P < 0.01, ***P < 0.001, and ****P < 0.0001).
