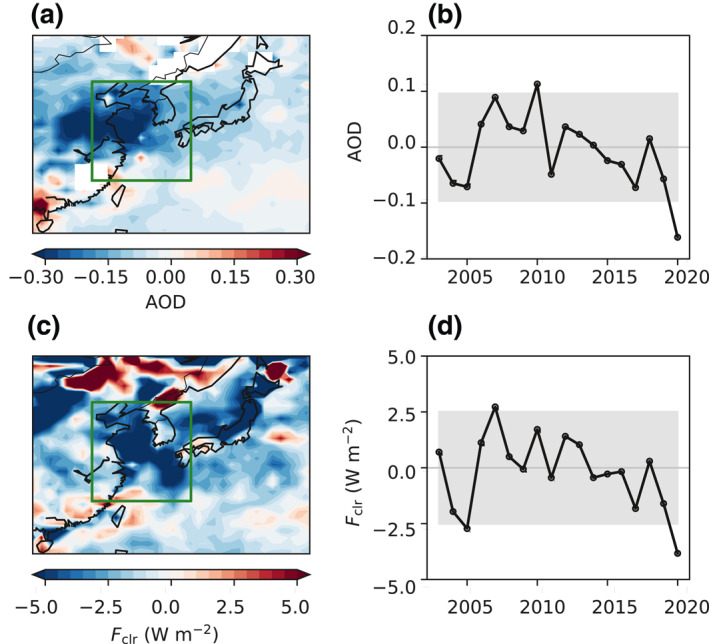
Figure 1.

(a) Spatial distribution of the anomaly in MODIS aerosol optical depth (AOD) in March 2020. The oceanic region enclosed by the green rectangle (117°–132°E and 26°–41°N) is defined as the East Asian Marginal Seas (EAMS). (b) Time series of the anomaly in MODIS AOD over EAMS in March from 2003 to 2020. The gray area denotes the 90% confidence interval over the climatological period. (c) Same as (a), but for CERES shortwave clear‐sky top‐of‐atmosphere (TOA) radiative flux (F clr, upward defined as positive). (d) Same as (b), but for CERES F clr. The climatology is defined as 2003–2019. MODIS, Moderate Resolution Imaging Spectroradiometer; CERES, Clouds and the Earth's Radiant Energy System.
