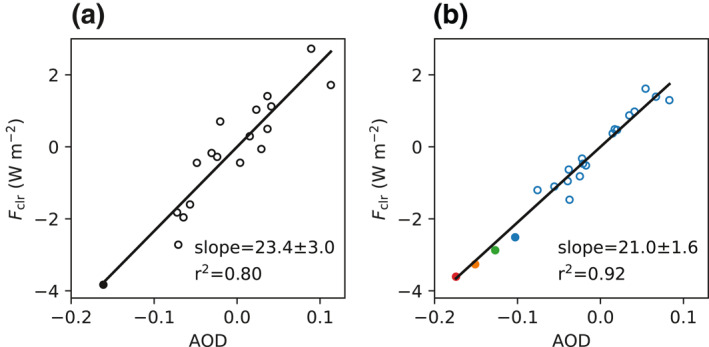
Figure 3.

Scatter plots of the anomalies in AOD and F clr in March over EAMS. Open dots represent the climatological period (2003–2019) and solid dots represent the year 2020. (a) Observations from MODIS and CERES. (b) Blue dots are from the control model simulation. Green, orange, and red dots correspond to the 20%, 40%, and 60% perturbation simulations, respectively. The regression line is calculated for the climatological period (2003–2019). AOD, aerosol optical depth; MODIS, Moderate Resolution Imaging Spectroradiometer; CERES, Clouds and the Earth's Radiant Energy System.
