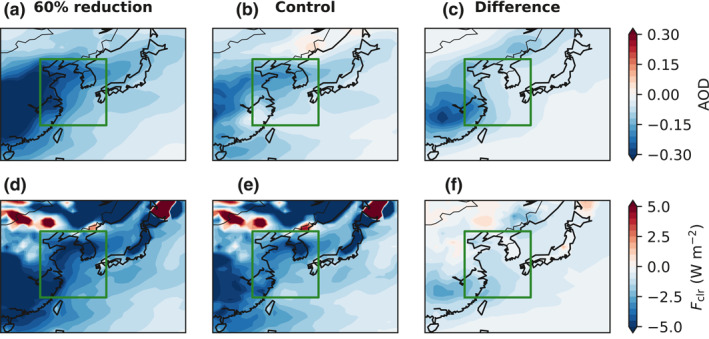
Figure 4.

(a) Spatial distribution of the anomaly in AOD in March 2020 from the 60% perturbation simulation. The green rectangle denotes EAMS. (b) Same as (a), but for the control simulation. (c) The difference between (a) and (b). (d)–(f) Same as (a)–(c), but for simulated F clr. The climatology is defined as 2003–2019 in the control simulation. AOD, aerosol optical depth; EAMS, East Asian Marginal Seas.
