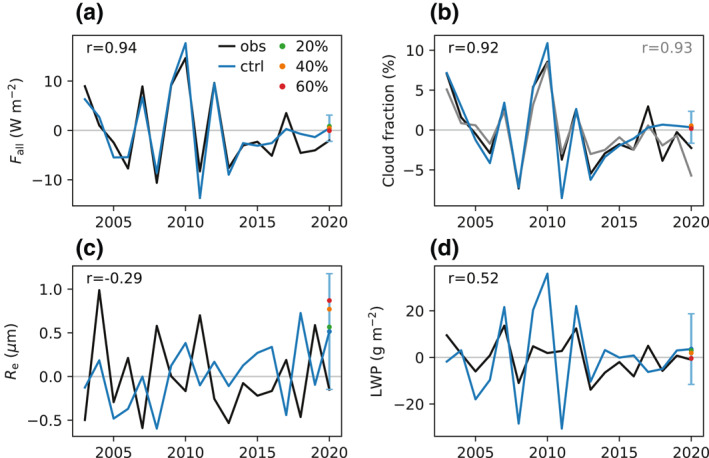
Figure 5.

(a) Time series of the anomaly in shortwave all‐sky TOA radiative flux (F all) over EAMS in March from 2003 to 2020. The black line is from CERES, and the blue line is from the AM4 control simulation. The vertical bar denotes the detection limit. The green, orange, and red dots denote the perturbation simulations of 20%, 40% and 60% emissions reductions, respectively. r is the correlation coefficient. (b) Same as (a), but for cloud fraction. The black line is from CERES, and the gray line is from MODIS. The detection limit is based on CERES. (c) Same as (a), but for cloud effective radius (R e). (d) Same as (a), but for liquid water path (LWP). In (c) and (d) the observation is from MODIS. MODIS, Moderate Resolution Imaging Spectroradiometer; CERES, Clouds and the Earth's Radiant Energy System; TOA, top‐of‐the‐atmosphere; EAMS, East Asian Marginal Seas.
