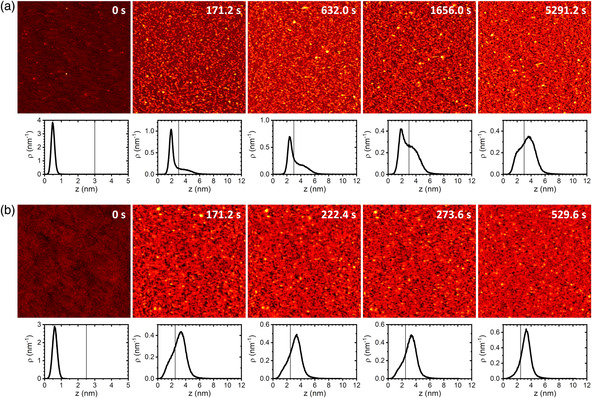
Figure 2.

HS‐AFM images (1 × 1 μm2) of SARS‐CoV‐2 spike protein S1 in 10 mM Tris (pH 7.5) adsorbed to a) an Al2O3(0001) and b) a TiO2(100) surface recorded at different time points as indicated. Height scales are 5 nm for the clean substrate surfaces at 0 s and 12 nm for the protein covered surfaces at later time points. Below the HS‐AFM images, the corresponding height distribution functions are depicted. The vertical lines in the plots represent the height thresholds applied in the statistical analyses.
