
Figure EV2. Transcriptomic analysis of differentiation toward bronchioalveolar‐like cells from lung bud tip organoids.
-
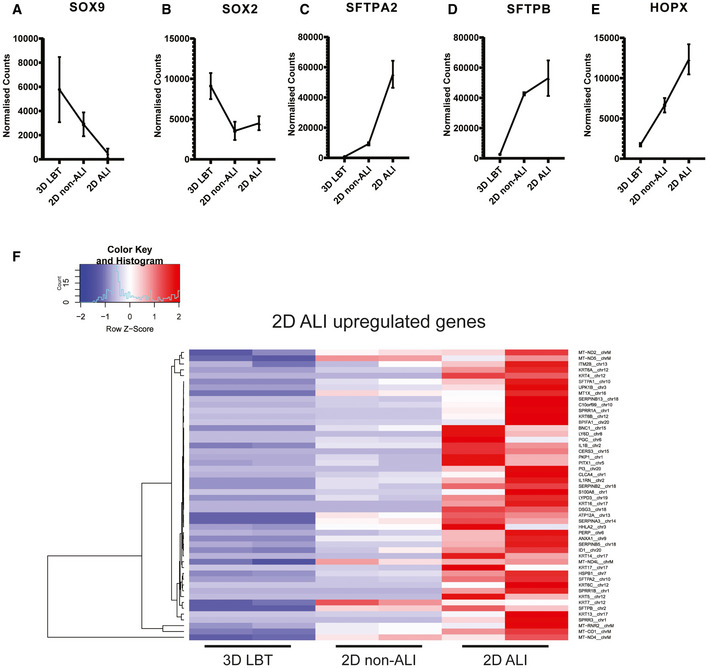
A–ELine graphs indicating normalized read count of 3D lung bud tip organoids (3D LBT), airway organoids on transwell system with apical medium (2D non‐ALI), and 2D bronchioalveolar‐like air–liquid cultures (2D ALI). n = 2 and error bars represent stdev. (A, B) Graphs depicting fetal bud tip progenitor markers SOX9 and SOX2. (C, D) Graphs depicting ATII markers SFTPA2 and SFTPB. (E) Graphs depicting ATI marker HOPX.
-
FHeatmaps depicting top 50 enriched genes in 2D bronchioalveolar‐like air–liquid cultures (2D ALI) compared to 3D lung bud tip organoids (3D LBT). N = 2 of 3D LBT, airway organoids on transwell system with apical medium (2D non‐ALI), and 2D ALI. Colored bars represent Z‐scores of log2‐transformed values.