
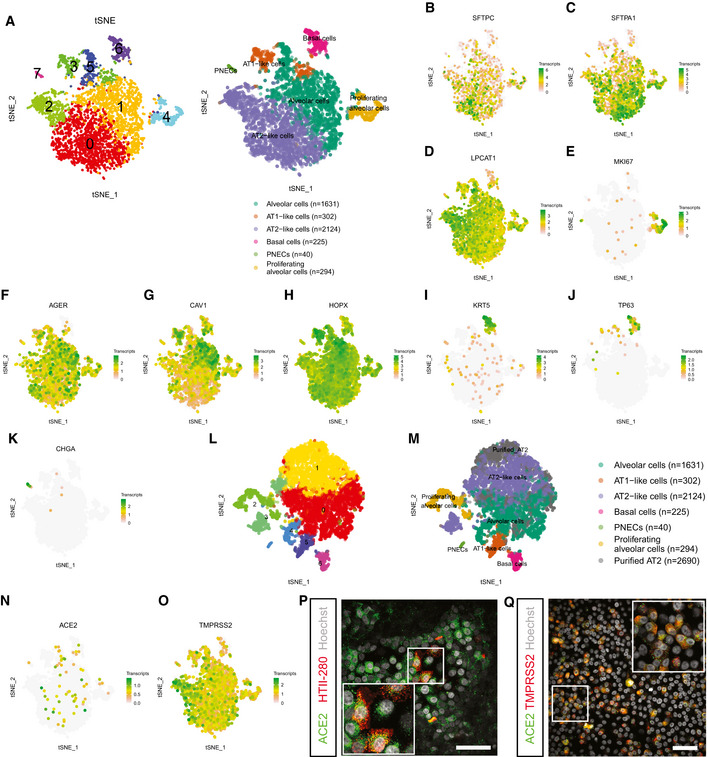
Figure 4. Single‐cell analysis of bronchioalveolar cultures.
-
At‐SNE maps showing clustering based on differentially expression analysis and highlighting cell type identification of bronchioalveolar cultures based on cell makers. Each color represents a cluster or different cell type. Number indicates number of cells in cluster identified as cell type presented.
-
B–Kt‐SNE maps highlighting the expression of marker genes for each of the cell types. Transcript counts are given in a Log2 scale.
-
Lt‐SNE map showing clustering based on differentially expression analysis including dataset from (A) and published dataset of GSM2855485. Each color represents a single cluster.
-
Mt‐SNE map showing clustering of (L) with annotation of cell types. Cell type annotation is transferred from (A), and published dataset GSM2855485 is annotated as “Purified AT2”. Number indicates number of cells in cluster identified as cell type presented.
-
N, Ot‐SNE maps highlighting the expression of SARS‐CoV‐2 entry receptors ACE2 (N) and TMPRSS2 (O). Transcript counts are given in a Log2 scale.
-
PDifferentiated bronchioalveolar cultures express SARS‐CoV‐2 entry receptor ACE2 (green) on ATII‐like cells marked by HTII‐280 (red). Nuclei are stained with Hoechst and shown in white. Scale bar indicates 50 μm.
-
QBronchioalveolar cultures co‐express both entry receptors ACE2 (green) and TMPRSS2 (red). Nuclei are stained with Hoechst and shown in white. Scale bar indicates 50 μm.