
Figure 6. Host response analysis of SARS‐CoV‐2 infection in organoid‐derived bronchioalveolar‐like and small airway cells.
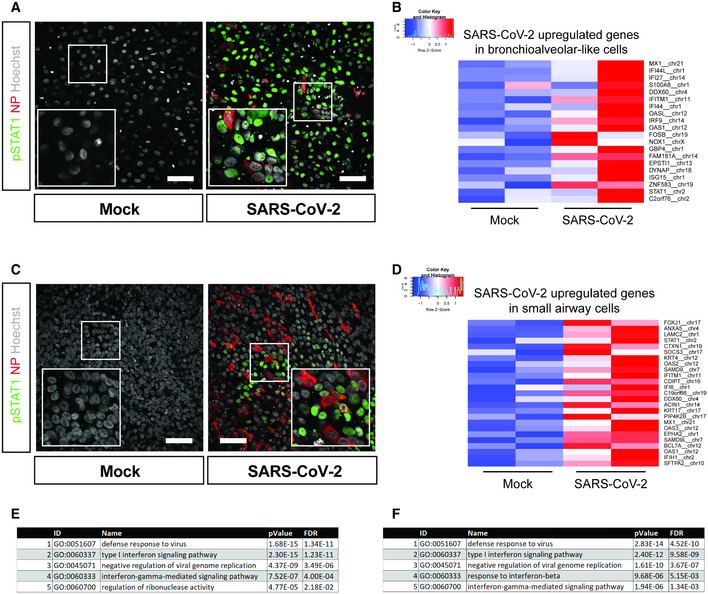
- pSTAT1 translocation in mock and SARS‐CoV‐2‐infected bronchioalveolar‐like cells visualized in green. Scale bars indicate 50 μm. Nucleoprotein (NP) stains viral capsid (red). Nuclei are stained with Hoechst (white). Scale bar indicates 50 µm.
- Heatmaps depicting top 20 enriched genes based on adjusted P‐value in bronchioalveolar‐like cells after SARS‐CoV‐2 infection. Colored bars represent Z‐scores of log2‐transformed values.
- pSTAT1 translocation in mock and SARS‐CoV‐2‐infected small airway cells visualized in green. Nucleoprotein (NP) stains viral capsid (red). Nuclei are stained with Hoechst (white). Scale bar indicates 50 μm.
- Heatmaps depicting top 25 enriched genes based on adjusted p‐value and log2 fold changes in small airway cells after SARS‐CoV‐2 infection. Colored bars represent Z‐scores of log2‐transformed values.
- GO term enrichment analysis for biological processes of the 20 most significantly up‐regulated genes upon SARS‐CoV‐2 infected in bronchioalveolar‐like cells. P‐values were determined using PANTHER Overrepresentation Test.
- GO term enrichment analysis for biological processes of the 25 most significantly up‐regulated genes upon SARS‐CoV‐2 infected in small airway cells. P‐values were determined using PANTHER Overrepresentation Test.