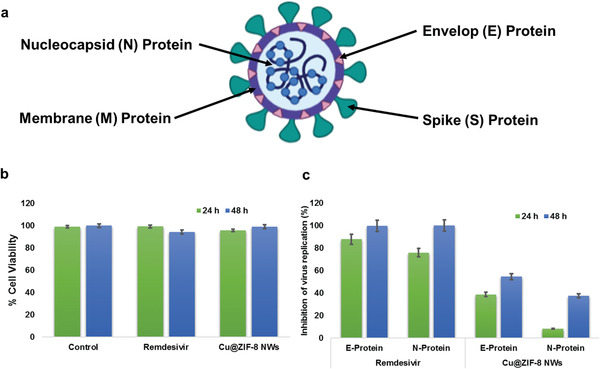
Figure 7.

a) Schematic of SARS‐CoV‐2 showing S, N, E, and M structural proteins; b) Bar graph showing cytotoxicity of Cu@ZIF‐8 NWs and Remdesivir on Vero E6 cells; c) Bar Graph showing antiviral effects of Cu@ZIF‐8 NWs and Remdesivir at 24 h and 48 h post infection.
