
FIGURE 2.
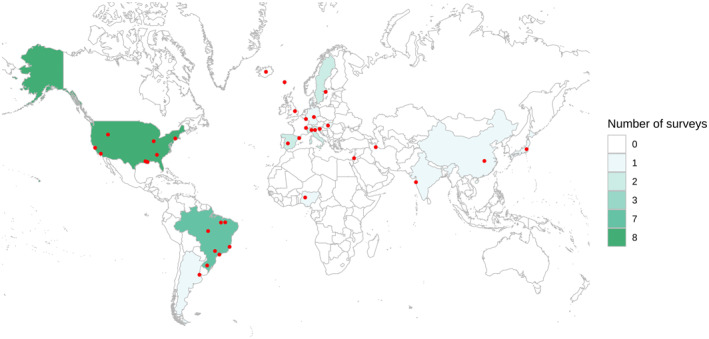
Map of countries and specific regions with prevalence surveys. Red dots represent regions and cities where the initiatives were performed. In nationwide studies, the point was placed in the centre of the country
Official websites use .gov
A
.gov website belongs to an official
government organization in the United States.
Secure .gov websites use HTTPS
A lock (
) or https:// means you've safely
connected to the .gov website. Share sensitive
information only on official, secure websites.
Map of countries and specific regions with prevalence surveys. Red dots represent regions and cities where the initiatives were performed. In nationwide studies, the point was placed in the centre of the country