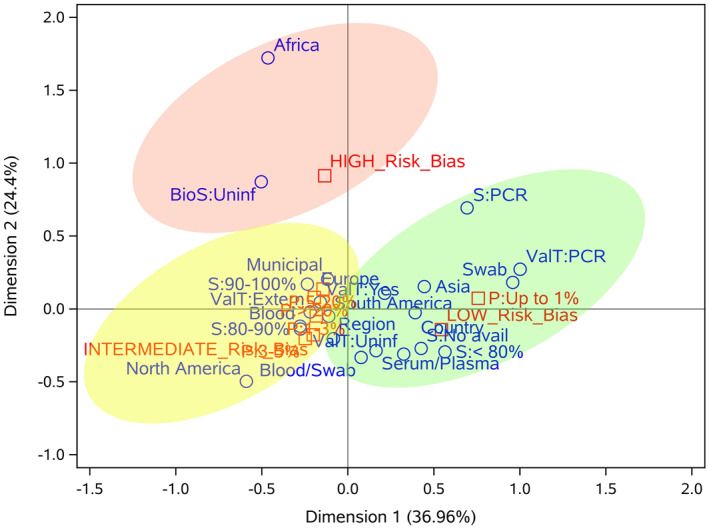
FIGURE 5.

Correspondence analysis of seven important variables of population‐based Covid‐19 prevalence surveys. The categories of row (continent, coverage, biological samples, test validation and sensitivity) and column (risk of bias and prevalence) variables are represented in blue and red, respectively. Light red, yellow and green ellipses represent high, intermediate and low risk of bias, respectively. BioS, biological sample; S, sensitivity; P, prevalence; ValT: test validation
