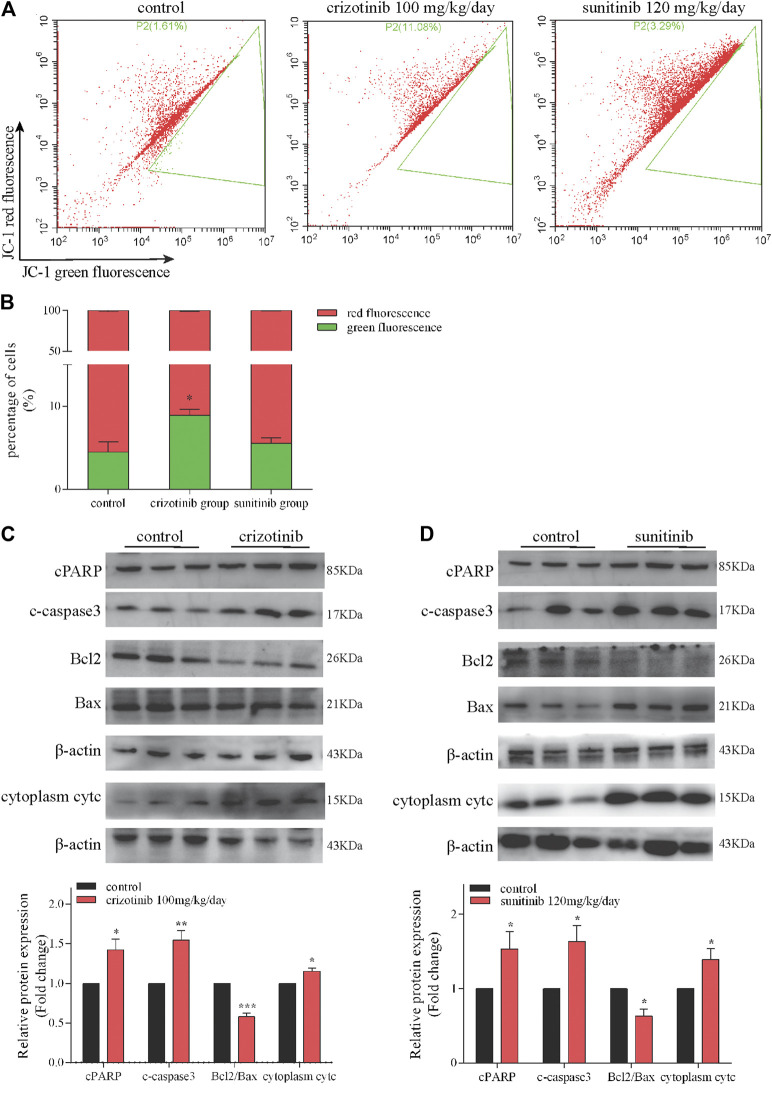
FIGURE 3.
Crizotinib and sunitinib induced mitochondrial apoptosis in vivo. (A, B) The ratio of red-to green-stained cells after different treatment is shown (n = 5–6). In the flow diagram, the abscissa represents the green fluorescence of JC-1, and the ordinate represents the red fluorescence of JC-1, and P2 (xx%) represents xx% of the cells under green fluorescence. (C, D) The levels of apoptosis signaling proteins (cPARP, c-caspase3, Bcl2, Bax and cytc) were measured by western blotting (n = 6). *p < 0.05, **p < 0.01 and ***p < 0.001 vs. control group.

