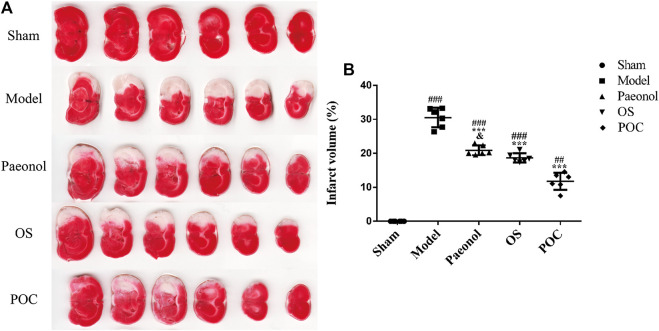
FIGURE 7.
Cerebral infarction volume. (A) The TTC staining. Normal brain tissue was stained dark red, while the infarct area was stained pale white. (B) On the x axis, the rats are divided into five groups: sham group, model group, paeonol group, OS group and POC group. The y axis displays the cerebral infarction volume. Compared with the sham group, ### p < 0.001, ## p < 0.01. Compared with the model group, *** p < 0.001. Compared with the POC group, & p < 0.05 (n = 6).

