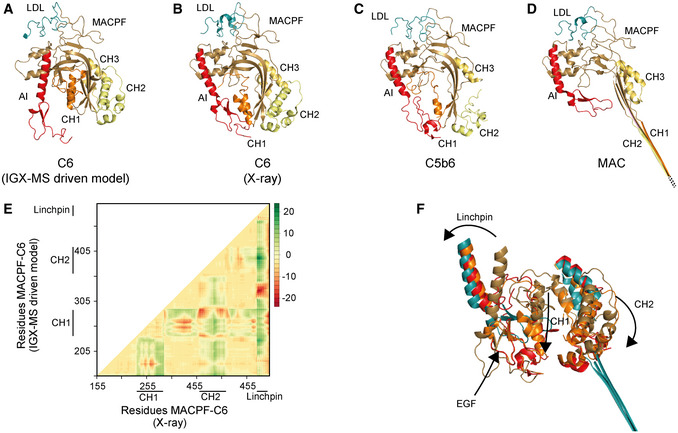
Figure EV2.

Structural rearrangements of the AI and CH regions of C6 when going from free C6, the C5b6 intermediate structure to C6 in the fully assembled MAC
-
A–DCartoon representation of the LDL (deep cyan) and MACPF (sand) domains within the IGX‐MS‐driven C6 model (A), C6 from the X‐ray structure (PDB ID: 3T5O) (B), C6 complexed with C5b (PDB ID: 4A5W) (C), and C6 as part of the MAC (PDB ID: 6H03) (D). The regions CH 1‐3 (orange, pale yellow, and yellow orange) and autoinhibitory (AI, red) within MACPF are shown.
-
EThe difference distance matrix of superposed C6‐MACPF domains. The difference distance was calculated by subtracting the coordinates of aligned MACPF backbones of the IGX‐MS‐driven model and the I‐tasser model (for complete sequence coverage) of C6‐X‐ray structure (PDB ID: 3T5O). The distance values are plotted with colors representing Cα differences of −20 to 20 Å according to the right‐sided scale.
-
FOverlay of the AI (composed of linchpin helix and EGF domain), CH1, and CH2 regions of MACPF in four distinct conformations of C6, namely the IGX‐MS‐driven model (sand), the deposited C6 X‐ray structure (orange), when incorporated in the C5b6 complex (red), and finally when incorporated in the fully assembled MAC (deep cyan). Arrows indicate the conformational changes of the different regions from free C6 (IGX‐MS‐driven model) to partial activation (PDB ID: 3T5O) and C5b binding (PDB ID: 4A5W) and final assembly into the MAC (PDB ID: 6H03).
Data information: MACPF structural coordinates were obtained from indicated structures and the IGX‐MS‐driven model.
