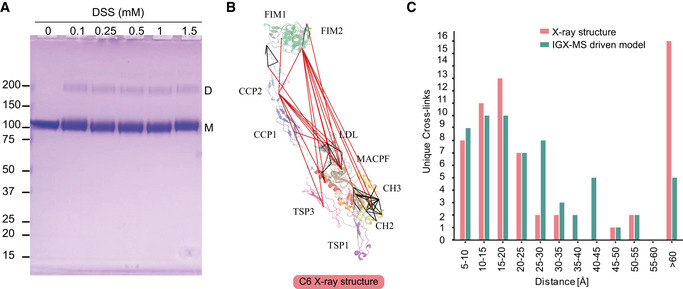
Figure EV3. In‐solution XL‐MS of C6.

- DSS concentration optimization for cross‐linking C6 in‐solution monitored by SDS–PAGE. The upper band (~200 kDa) indicates a C6 dimer that is formed upon cross‐linking, whereas the more abundant lower band (~100 kDa) represents monomeric C6.
- Obtained cross‐links for monomeric C6 plotted on the available X‐ray structure of C6 (PDB ID: 3T5O). The red lines indicate distances > 30 Å. The different domains of C6 are indicated in black.
- Distribution of lysine Cα‐Cα distances of unique cross‐links identified by in‐solution XL‐MS for monomeric C6 when plotted on the reported X‐ray structure (pink bars, PDB ID: 3T5O) and the IGX‐MS‐driven refined structural model (green bars). The average distance of all cross‐links is 41.7 Å when using the X‐ray structure which reduces to 26.2 Å for the IGX‐MS‐driven structural model.
Data information: Only cross‐links identified in at least two of three replicates were included in the analysis.
