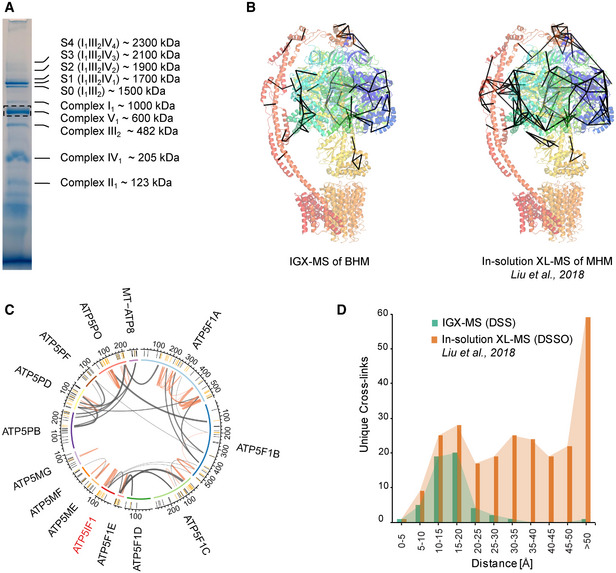
Figure 4. Selective cross‐linking of the ATP synthase monomer from bovine heart mitochondria (BHM) by IGX‐MS.

- BN‐PAGE of 20 µg solubilized BHM with several of the distinct complexes annotated. The dashed box indicates the monomeric ATP synthase (complex V) band subjected to IGX‐MS. Annotation of protein bands was done following a previously published study (Wittig et al, 2010).
- Unique cross‐links < 30 Å identified by IGX‐MS in this study (left) or by Liu et al (2018) using in‐solution XL‐MS plotted on the ATP synthase structure (PDB ID:5ARA).
- Circos plot of cross‐linked ATP synthase subunits and the ATP synthase inhibitor (ATP5IF1) identified by IGX‐MS. The position of the lysine residues is shown in the outer‐ring, and cross‐linked residues are colored dark orange. Orange lines represent intra‐links, while inter‐links are colored dark gray. Thickness of the cross‐link lines correlates to the number of detected cross‐linked spectra matches (CSMs).
- Distribution of lysine Cα‐Cα distances of unique cross‐links identified by IGX‐MS or in‐solution XL‐MS (Liu et al, 2018) using DSS (1.5 mM) or DSSO (0.5 mM), respectively.
Data information: The presented IGX‐MS data are summed from triplicates. For illustration, the same BN‐PAGE of solubilized BHM is repeatedly shown (see Fig EV1A).
